Technical analysis LTC – further growth after consolidation?
2 min readAfter a long time, Litecoin (LTC) finally broke through an important S / R level, which prevented the market from returning to price bands above USD 200. This is therefore a fairly important step forward, which may be the starting point for price expansion to the new all-time high. However, the journey is very long for Litecoin.
Current situation at 1D LTC / USD
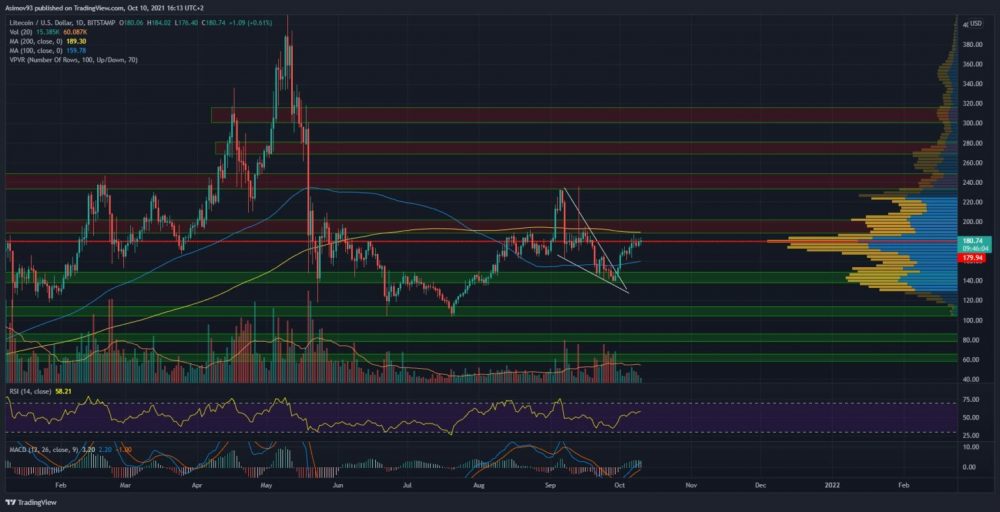
As mentioned, Litecoin has finally made it through about $ 195. The course was really below that level for quite some time, which didn’t work well at all. The breakthrough itself was very solid, because the breakthrough candle has an impulse form. Who wouldn’t believe such a breakthrough then? However, it has a hook in those volumes that were quite low.
With such a breakthrough, of course, it makes sense for volumes to go hand in hand with rising prices. So far, nothing like this is happening, which is naturally a negative signal. In any case, the course is now testing the S / R level of USD 195, so the former resistance is becoming support. I must point out that the level must withstand the onslaught of sellers. Otherwise, further price expansion is less likely.
However, the other resistances mentioned should no longer be such a breakthrough problem. In this respect, I am mainly based on the volume profile. Some high volume node (greater profile sharpness) is close to the S / R level of 240 USD. But then there are not so many obstacles, as evidenced by the rapid fall in May. Those levels were not very strong, so the exchange rate was not able to bounce back from them at that time.
Indicators
The market reacted negatively at the borderline 70 points for the RSI indicator. This level always plays the role of resistance. In any case, it is very important that the breakthrough succeeds. For the continuing bullish trend, it is necessary that the values of the indicator go above this level without the market fluctuating. There is a bearish divergence on the MACD histogram and the momentum is not very strong.


